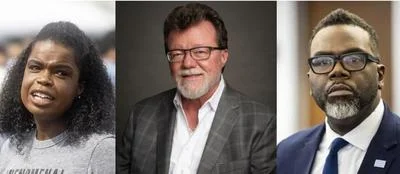
Chicago Teachers' Union President Stacy Davis-Gates says $9.5 billion is still too small a budget for Chicago Public Schools. | Twitter.com
Chicago Teachers' Union President Stacy Davis-Gates says $9.5 billion is still too small a budget for Chicago Public Schools. | Twitter.com
Chicago Public Schools has lost 65,000 students since the 1996-97 school year. But its annual budget has increased by $4.4 billion dollars-- a jump of 50 percent, adjusted for inflation.
That's according to an analysis of historical CPS spending and enrollment data compiled by the Illinois State Board of Education.
In 1996, the average daily attendance at CPS was 357,626 and its annual budget was $2.94 billion.
Last year, in 2021, CPS' average daily attendance was 299,872 and it spent $7.31 billion.
The spending increase has been primarily fueled by a massive increase in state taxpayer funding of CPS, as well as large property tax increases on Chicago residents.
In 1996-97, adjusted for inflation, state government contributed $1.35 billion to Chicago K-12 school operations.
Last year, Springfield sent CPS $2.02 billion, an increase of 153 percent. That's even while CPS enrollment continued to fall.
State funding is allocated per pupil; state taxpayers' contribution to CPS rose from $3,777 in 1996-97 to $6,743 in 2021.
In 1996-97, CPS ranked 492 of 905 Illinois districts in per-pupil state funding. Its state funding was slightly less than the state's average of $3,796.
Last year, CPS ranked 204th of 850 districts, with its state funding 40 percent higher than the state average of $4,849 per pupil.
Property tax bills for Chicagoans have risen to fund CPS' budget growth as well.
Inflation-adjusted, Chicago property taxpayers are paying $2.4 billion more to fund CPS today than they were 25 years ago-- $6,769 per household, up from $4,676 in 1996-97.
In June, the district announced it will spend $9.5 billion in 2023, the equivalent of $31,680 per pupil at its 2021 average attendance level.
The Chicago Teachers' Union said that record-high budget, which amounts to one-third of all Illinois K-12 tax dollars spent annually, is "unacceptable" and should be higher.
“Chicago Public Schools students and families have dealt with two years of trauma from the COVID-19 pandemic, in addition to the trauma many of them face from gun violence, discrimination, regressive fines and fees, and neglect of their communities," a statement read.
In 2021, 21 percent of CPS students tested at grade level for English, and 16.5 percent for math, according to the Illinois Assessment of Readiness (IAR).
Of CPS graduates attending community college, 61 percent required remedial classes, taking high school classes over again, according to the Illinois State Board of Education.
Bigger percentage of the state K-12 pie
Still, suburban and downstate taxpayers are giving a higher percentage of K-12 funding to CPS than ever before, even while the district is shrinking.
In 1996-97, CPS made up 21 percent of the state's elementary and high school enrollment. It received 23 percent of state K-12 funding.
Last year, it made up 18 percent of state enrollment, and received 24 percent of state funding.
In contrast, Lake County's 46 school districts reported 113,201 students in 2021 and received $534.6 million in state funding, or and average of $4,722 per pupil.
All told, between 1996-97 and 2021, enrollment in Illinois public schools statewide fell by 55,000 students, or 3.1 percent.
Over the same period, taxpayer spending by Illinois public schools rose by 11.3 billion-- or 52 percent.
Local property taxpayers are spending $6.7 billion more for public schools today than they were in 1997-- when the Illinois school system had fewer students.
------
Chicago Public Schools- Fewer students, but more tax dollars
Chicago's Public schools' system is shrinking rapidly. But as it does, the district's budget is growing to record levels, fueled by increased funding from suburban and downstate taxpayers and higher Chicago property tax bills.
| CPS | ||||
| Enrollment | State Funding | Prop Tax Funding | Total Spending | |
| 1997 | 357,626 | $1,350,600,695 | $2,509,305,529 | $4,965,751,763 |
| 2016 | 351,726 | $1,738,908,514 | $3,217,038,188 | $6,856,276,226 |
| 2019 | 329,956 | $1,955,736,594 | $3,670,609,102 | $6,782,890,553 |
| 2021 | 299,871 | $2,022,144,546 | $3,886,751,611 | $7,318,229,395 |
| 16% decrease | 50% increase | 55% increase | 47% increase | |
| All Illinois Public Schools | ||||
| Enrollment | State Funding | Prop Tax Funding | Total Spending | |
| 1997 | 1,734,004 | $5,867,217,587 | $14,612,004,296 | $23,052,779,619 |
| 2016 | 1,838,813 | $6,624,088,656 | $16,496,952,850 | $26,026,588,190 |
| 2019 | 1,768,913 | $5,902,420,893 | $14,699,676,321 | $23,191,096,297 |
| 2021 | 1,679,457 | $8,567,173,514 | $21,344,297,451 | $33,838,694,010 |
| 3% decrease | 46% increase | 46% increase | 47% increase |
Source: Illinois State Board of Education; all 2016, 2019, 2021 dollars are inflation-adjusted.


 Alerts Sign-up